
12 Key Performance Indicators For Successful Online Business
All great businesses focus on specific key performance indicators in order to meet strategic and operational goals.
But not all KPI’s are the same as they vary from company to company and depend on priorities.
Whether you’re running an online or offline business, you should regularly monitor revenue, cart abandonment, cash position, receivables, payables, and basic accounting reports. If you sell physical products, you can utilize an accounting system such as QuickBooks or FreshBooks to monitor your cost-of-goods sold and daily gross profit.
You’ll also want to incorporate and monitor pay-per-click advertising reports, social media metrics (likes, shares, clicks, comments, etc), email marketing results, and marketplace sales (such as internal, Cj.com, Clickbank, Amazon, or eBay) to identify areas of needed improvement.
Any measurement can become a KPI as long as you have a means of capturing the data.
The 12 Essential KPIs For A Successful Online Business
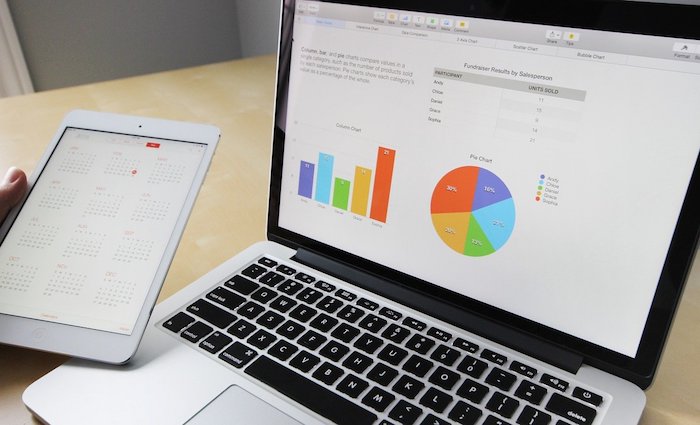
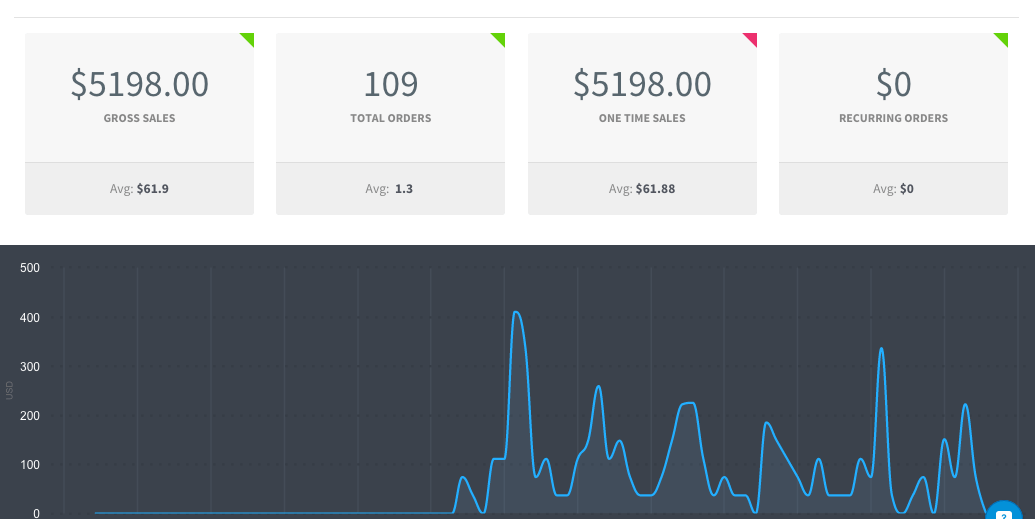
#1. Monthly, Quarterly & Annual Sales
We track many metrics based on our current top priorities.
One thing that doesn’t change is tracking monthly, quarterly and annual sales (and the breakdown of which channels the sales came from, which products sold most in which geographical areas, and WHY).
We keep a weekly scorecard, based on the process outlined in Traction by Gino Wickman. I highly recommend the book and resources at https://eosworldwide.com for anyone with a leadership team in their company.
If people are paying us every month, they must be happy. Revenue allows us to pay our developers so we can build more awesome features to make our customers even happier.
#2. Email List Activity
The size and quality of your email list can reveal much about your business. The number of people opting in daily, to the number of people opening our messages and actually reading them tells us where we need to focus our efforts.
Major email services such as AWeber and iContact will automatically track the most important KPIs…
Here are the key performance indicators to focus on with email marketing:
- Open rate
- Bounce rate
- Purchase rate
- Click-through rate
- New subscriber growth
And here are some of the ways to make more money from email marketing.
Of course, depending on your niche, you may not exclusively be selling via email blasts. You could for example be selling using the telephone.
#3. Customer Acquisition Cost
Another important KPI is the cost to acquire a customer. This usually comes into play when you’re paying for traffic and means you’ll need to know the exact cost to acquire each customer or risk losing a ton of money advertising.
You can discover how much each new customer costs by dividing the total marketing costs by total amount of new customers during a specific time period.
For example, this is how you’ll measure Pay Per Click advertising costs…
PPC results vary by industry and competitiveness, but for example’s sake, let’s assume the following:
- Total Click-Throughs: 5,000
- Total Campaign Cost: $40,000 (includes set-up, landing page design, ad expenditures, etc.)
- Conversion Rate: 8%
So out of the 5,000 who clicked your ad and were taken to the landing page, 400 visitors converted to a “sale.” We know the cost per acquisition is $40,000/400, or $100, which is $100 less than our initial threshold.
Key performance indicators (KPIs), are also essential for defining the success of a digital campaign and how well the advertising budget has been invested. This article from AdRoll covers this topic in a lot more detail.
#4. The Traffic Sources Of The Sales
The main things that we track, are sales and the traffic sources that are driving those sales. OntraPort is something that helps organize and structure all of this data so we can then implement new strategies accordingly. It’s a supercharged business and has simplified many lives.
The Traffic Sources metric measures which traffic sources are driving visitors to your website, and provides a comparison of each of those sources. Search traffic, for instance, can be analyzed according to the landing page and associated keyword rankings; referral traffic can be broken down into categories such as social referrals, blog mentions, or service listings.
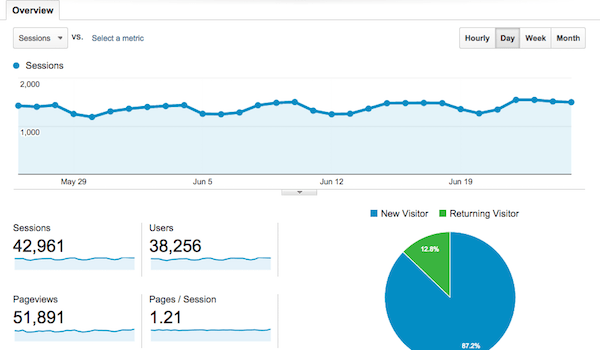
#5. Number Of Daily New Users
Set a goal for the year! Divide this number by the number of days in the year to give you the exact number of visitors you’ll need to hit daily in order to reach your goal.
Analytics is a great tool for tracking daily traffic – and it’s free.
The best way to increase the number of new website users is by frequently posting high-quality content.
#6. Unique Customers
Revenue is always the de-facto KPI for most other businesses, but we’re also believers in Vishen Lakhiani’s “smart number” methodology. The smart number we use internally is the monthly revenue/number of new unique customers that month.
If this metric goes down month to month, it indicates we either acquired fewer new customers or generated less revenue overall, both of which are signs something is “broken” or needing attention.
#7. Incremental Sales
The incremental sales KPI compares your marketing efforts to increase sales revenue over a specific period of time. This is a consistent way to measure your marketing return on investment as it demonstrates new revenue that can be directly attributed to a marketing campaign.
Here are several examples of return on investment.
#8. Sales Funnel
The sales funnel analyzes your customer acquisition process, revealing how leads discover your product or brand and, more importantly, how they eventually become customers.
Analyzing conversion rate from one stage of the funnel to the next is the key to a successful sales funnel. The strength of the funnel lies in the ability to highlight your strengths and weakness. For example, you may have great brand awareness due to large web traffic, but your ability to convert leads into sales may be weak.
If you need help setting up a successful sales funnel, there’s no better resource than Brian Moran’s Get 10,000 Fans!
#9. Goal Completion Rate
Goal Completion Rate or GCR for short, measures the number of users completing a specific marketing goal, such as signing up for a webinar or subscribing to a mailing list. The goal completion rate is an important part of your sales funnel as it suggests your conversion rate from the awareness stage to the consideration stage.
#10. Keyword Performance
The Keyword Performance metric measures your keyword rankings to understand how effective your SEO efforts are at driving organic traffic to your website. Keyword ranking is a leading indicator providing valuable information about your ability to improve existing rankings or rank for new keywords.
Ahrefs is the tool we use to track all our keywords and I would highly recommend it.
#11. Social Media Interaction
The Social Interaction KPI measures the ability of social media campaigns to create positive user engagement. When measuring social interaction, remember not all social interactions are created equal. For instance, you could argue retweets are more valuable than favorites on Twitter because a retweet ensures content circulation.
At the moment, I can tell you that each new subscriber we get on our photography project is worth a bit more than $3 after 45 days, and that’s valuable information to know when you’re investing $10k plus a month on growing subscribers with FB ads.
You can use software such as Buffer to track, automate and analyze all of your social media marketing.

#12. End Action Rate
The end action rate KPI or EAR for short measures the effectiveness of marketing your campaigns by monitoring the final action taken by your users. The EAR supplies your team with actionable information about your marketing campaign performance.
12 Key Performance Indicators To Track Right Now
- Track monthly, quarterly and annual sales and the breakdown of sales origin, what sold most in which geographical areas, and WHY.
- Monitoring how many emails you send compared to how many are opened.
- Track customer acquisition costs by dividing the total marketing costs by the total amount of new customers during a specific time period.
- Track sales and the traffic sources that are driving those sales.
- Set an annual traffic goal and divide this number by 365 days to give you the exact number of daily visitors needed to reach your goal.
- Know your smart number – monthly revenue/number of new unique customers each month.
- Incremental sales measure the contribution of your marketing efforts against increasing sales revenue.
- Monitor your sales funnel because this analyzes the customer acquisition process to reveal how potential customers discover your product or brand and, more importantly, how they eventually become customers.
- The goal completion rate or GCR for short is a metric measuring the number of users completing specific goals, like webinar registration.
- The keyword performance metric measures your keyword rankings to understand how effective your SEO efforts are.
- Monitor the final action taken by your users in order to determine the effectiveness of your marketing.
- The social interaction KPI measures the ability of social media campaigns to create positive user engagement.
Now you know what each of our key performance indicators is, but what are yours? Your success depends on you and now you know exactly what to track in order to achieve it.
It is an immutable law in business that words are words, explanations are explanations, promises are promises but only performance is reality.
– Harold S. Geneen
See More Articles Related To Make Money Online
-

10 Best Ways To Make Money With a Website -
Write A Best Selling Book: 7 Strategies That Sold 2 Million Copies! -
How To Make Money Online: 15 Ways From The 30 Biggest Sites -

How to Monetize a Blog: 17 Best Strategies for 2025 -
FatJoe: SEO Services and Article Writing -
How To Increase Website Value: 21 Smart Ways That Work! -
See how much traffic your competitors are getting. -
How To Make Money Blogging: The Quickest Way To $100k -
10 Ways SamCart Will Increase Your Checkout Page Conversions -
10 Reasons Why SamCart is the Ultimate Shopping Cart Solution -
How To Increase Sales And Conversions in 2024 -
Call to Action Buttons: Best Examples and Tips -
How to Create a Website and Make Money Blogging in 2026 -
Website Optimization: 18 Strategies to Boost Sales and Traffic in 2024 -
How To Sell A Website For The Most Money Possible -
The Best Website Broker for 2024 -
9 Things Most Sales Pages Are Missing (fix these today to increase conversions!) -
How to Create a Killer Offer That Converts Like Crazy! -

Email Autoresponders: Use this strategy to make more money -
OptiMonk Review – The Best PopUp Software For Getting Email Subscribers!


")


